📈 Mastering Bollinger Bands: How to Trade Volatility Like a Pro
In trading, mastering technical analysis isn’t just about following signals — it’s about learning how to interpret and react to market behavior with precision. One of the most flexible and reliable indicators used by both beginners and seasoned traders is the Bollinger Bands indicator.
Let’s take a deep dive into what Bollinger Bands are, how they work, and how to use them to improve your edge in volatile markets. 🎯
💡 This is Part 13 of our AirdropHotList Trading Guide Series
📊 What Are Bollinger Bands?
Bollinger Bands are a technical indicator that visually measures market volatility and price action. Invented by John Bollinger in the early 1980s, these bands create a dynamic price envelope that adjusts in real time.
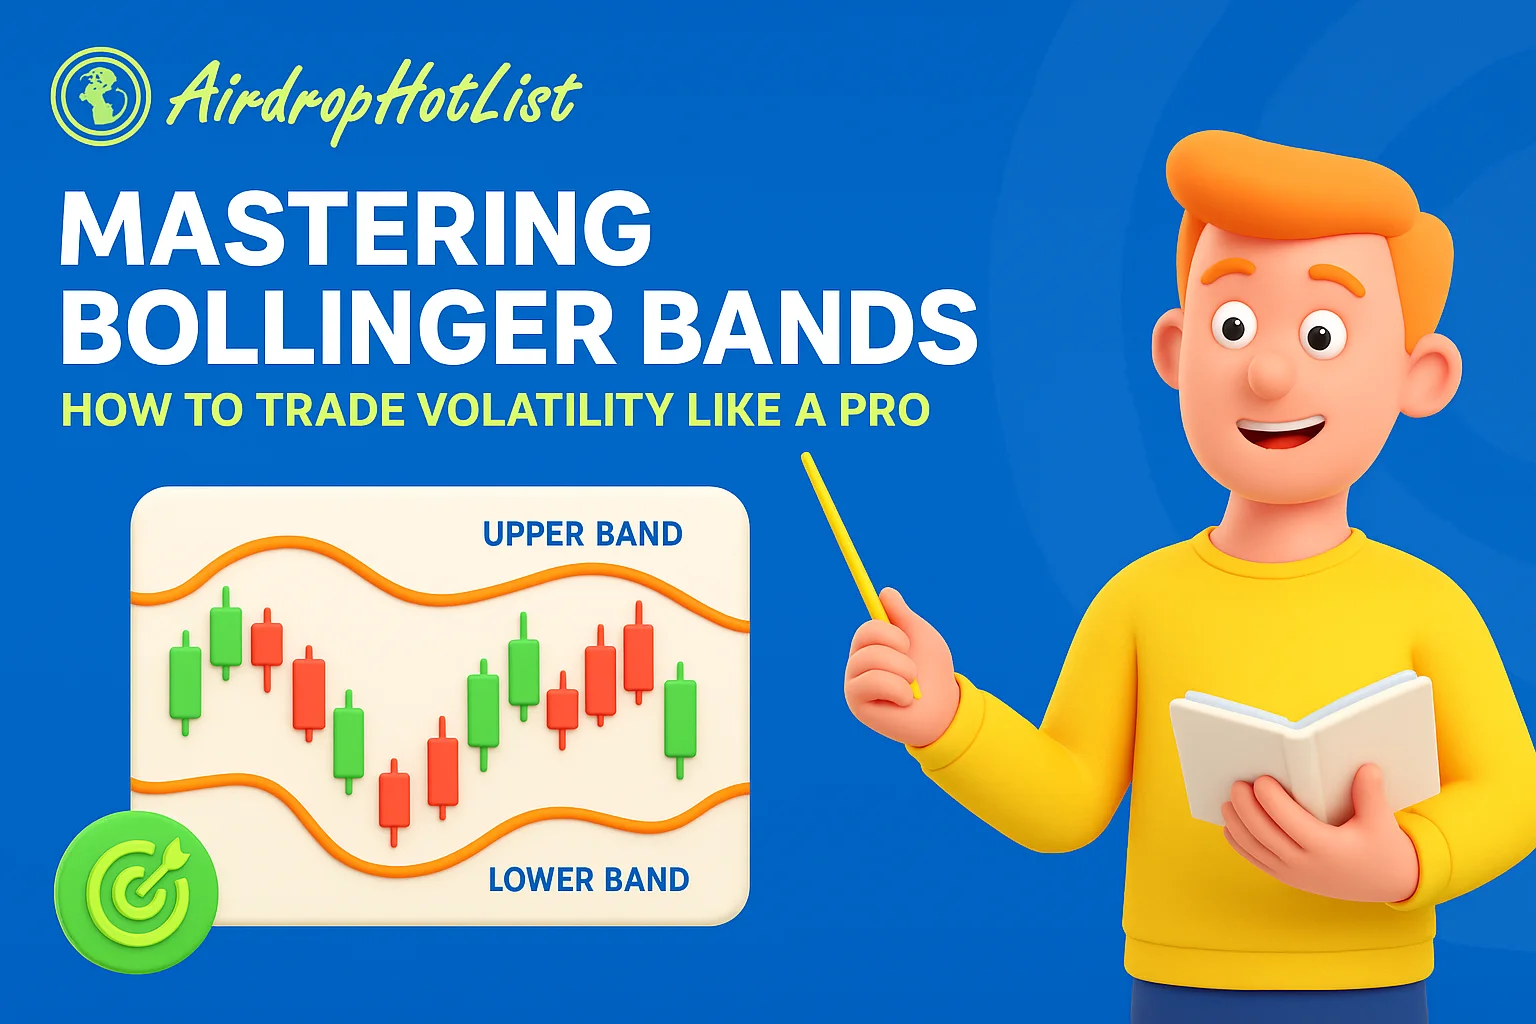
They consist of three lines:
-
Middle Band: A Simple Moving Average (typically 20-period)
-
Upper Band: Middle Band + 2 standard deviations
-
Lower Band: Middle Band – 2 standard deviations
When volatility increases, the bands expand. When it drops, the bands contract — signaling potential breakouts or quiet consolidation phases.
👨🏫 Who Is John Bollinger?
John Bollinger is a well-known market technician and founder of Bollinger Capital Management. With a background in statistics and engineering, he created the Bollinger Band system to make volatility visually trackable on price charts.
He introduced the concept that volatility isn't static — and that indicators must adapt as markets evolve.
Not every reward campaign deserves your time. Before you commit, compare this opportunity with our active airdrops list and focus on campaigns with clearer upside, better trust signals, and realistic participation steps.
🔧 How Bollinger Bands Work
Bollinger Bands adjust automatically based on market volatility:
-
Tight Bands = Low Volatility (possible breakout coming)
-
Wide Bands = High Volatility (trend continuation or reversal)
-
Price at the Upper Band = Overbought
-
Price at the Lower Band = Oversold
When price breaks out of either band, traders watch closely: Is this a real breakout or a fakeout?
🧮 How to Calculate Bollinger Bands
You can use any timeframe (1min, 1h, daily) depending on your strategy. Here's the basic calculation:
-
Choose a period (default: 20)
-
Calculate the Simple Moving Average (SMA)
-
Measure standard deviation for the same period
-
Add/subtract 2 deviations from the SMA for upper/lower bands
✅ Common settings:
| Strategy | Period | Deviation |
|---|---|---|
| Scalping | 10 | 1.5 |
| Swing | 20 | 2 |
| Trend | 50 | 2.5 |
If this opportunity involves trading, deposits, or exchange activity, review our crypto trading guide for beginners to understand fees, risk control, and safer decision-making.
📈 Bollinger Bands in Action
1. Identifying Market Trends
-
Rising Middle Band → Uptrend
-
Falling Middle Band → Downtrend
-
Flat Band → Range-bound market
2. Overbought & Oversold Signals
-
Price above Upper Band → Possible overbought
-
Price below Lower Band → Possible oversold
3. Mean Reversion (“The Bounce”)
In sideways markets, price tends to revert to the mean (middle band). Traders often:
-
Buy at the lower band
-
Sell at the upper band
4. Breakout Confirmation
Breakouts beyond the bands can signal new trends. Volume confirmation is key.
🔍 Combine with RSI or MACD for better confirmation.
⚙️ Bollinger Band Cheat Sheet
| Action | Meaning | Trading Idea |
|---|---|---|
| Narrow Bands | Low volatility | Prepare for breakout |
| Wide Bands | High volatility | Manage risk levels |
| Price at Upper Band | Overbought | Take profit / Short |
| Price at Lower Band | Oversold | Buy / Watch for bounce |
| Bounce from Lower Band | Mean reversion | Target middle or upper band |
| Price hugs Upper Band | Strong uptrend | Trend-following strategy |
📉 What to Watch For
Upper Band Signals
-
Expanding volatility
-
Overbought condition
-
Possible trend continuation or end
Use volume and RSI to validate strength.
Lower Band Signals
-
Oversold territory
-
Reversal potential
-
Panic selling or bearish confirmation
If price bounces back above the lower band, it’s often a long setup.
If you want to understand how eligibility, snapshots, claiming, and reward distribution usually work, start with our crypto airdrop guide before joining new campaigns.
🧠 How Reliable Are Bollinger Bands?
They are reactive, not predictive. So:
-
Best used with other indicators
-
Confirm with RSI, MACD, or volume
-
Avoid during erratic low-volume sessions
🔄 Alternatives to Bollinger Bands
If BBs aren’t giving clarity, consider:
-
Keltner Channels
-
Donchian Channels
-
ATR Bands
-
Moving Average Envelopes
Each has a different approach to volatility and trend measurement.
⚠️ Common Limitations
-
Lagging: Based on past price data
-
May trigger false breakouts in low-volume environments
-
Default settings don’t fit all markets
🔧 Adjust parameters or combine with other methods for better results.
✅ Summary: When & How to Use Bollinger Bands
| Market Type | Best Strategy |
|---|---|
| Trending | Use bands for breakout confirmation and trend-following |
| Ranging | Trade the bounce between upper and lower bands |
| Volatile | Use wider bands + volume confirmation |
| Low Volatility | Wait for squeeze breakout |
🧠 Final Thoughts
Bollinger Bands are one of the most trusted indicators in technical analysis — not because they predict the future, but because they help you respond to the present.
By measuring volatility, defining dynamic support/resistance, and highlighting breakout zones, Bollinger Bands can help you make more informed decisions. Used properly, they add clarity to charts filled with noise.
But remember: no indicator works in isolation. Pair BBs with volume, RSI, and strong risk management for best results.
📚 Keep learning, keep backtesting — and let the bands guide your edge.


 Gaming Platforms
 Crypto Casinos
 Blockchain Bridges
 Staking & Restaking
 DEX Token Swapping
 Crypto Wallets